SVG has a few metadata features intended specifically for accessibility, and also provides the ability to use real text instead of images for textual content, just like HTML. This combination of text and metadata serves as one of the cornerstones of SVG’s accessibility; there are other features, such as scalability and navigation features, but this post will focus on the descriptive capabilities of SVG.
I was recently looped into a discussion on the @longdesc attribute in HTML which dealt in part with SVG accessibility, a subject I’m fascinated by. The specific debate is whether a @longdesc value should be applied for SVG, or whether SVG’s native accessibility features should be used, or both.
Let me explain @longdesc. For short descriptions of a picture, a few words to a few sentences, you can simply include the text in the <img> element’s @alt attribute. The @longdesc attribute of an <img> element allows a content author to add a URL that leads to a longer text description of the image. You can read more in this excellent article on @longdesc by WebAIM.
SVG provides a different way to provide text descriptions: the <title> and <desc> elements, which can be a child of any graphic or container element in SVG, and which contain text descriptions of the element. The <title> is meant for shortish names, while the <desc> can provide arbitrarily long descriptions; nothing in the SVG spec limits the length of these elements, but choosing the appropriate text is a best practice (as for any prose). These metadata elements can be read out via screenreaders (accessibility technology that speaks the available text aloud), along with the content of the <text>, <tspan>, and <textPath> elements.
Because each SVG shape (or group of shapes) can have its own <title> and <desc>, a certain amount of structure and sequential flow is available to these screen readers. Each text or metadata element is read out in document order. Together, the series of text passages can comprise a complete description of the SVG graphic. Which is kinda cool… self-describing images!
Well, that’s the idea, anyway. Now let’s look at it in practice, and specifically, at authoring SVG accessible content, and support in browsers and screenreaders.
Note:Â though I offer some specific guidance here, this is not really a tutorial; it’s more a background article on the topic, partly from a standardization point of view. I’ll be writing a tutorial aimed at developers and designers soon on WebPlatform.org.
Simple Example
Before we go any further, here is an example of a simple SVG file with titles and descriptions, just to provide some context:
  <svg xmlns="http://www.w3.org/2000/svg"
       xmlns:xlink="http://www.w3.org/1999/xlink"
       width="100%" height="100%" viewBox="0 0 160 180">

    <title>Star</title>
    <desc>2 overlapping triangles, forming a blue and gold 6-pointed star, with a blue circle in the background</desc>

    <circle cx="80" cy="90" r="75" fill="none" stroke="cornflowerblue" stroke-width="5"/>
    <g style="stroke-width:5; stroke-linejoin:round;">
      <title>Triangles</title>
      <polygon id="triangle-up" points="80,10 150,130 10,130" fill="gold" stroke="cornflowerblue">
        <title>Upwards triangle</title>
        <desc>A gold equilateral triangle, pointing upwards, with a blue outline.</desc>
      </polygon>
      <polygon id="triangle-down" points="150,50 80,170 10,50" fill="cornflowerblue" stroke="gold">
        <title>Downwards triangle</title>
        <desc>A blue equilateral triangle, pointing downwards, with a gold outline.</desc>
      </polygon>
    </g>
  </svg>
And here’s what it looks like (proof positive that I’m not a designer):

Here, we have a title and description for the whole document, and the 2 triangle graphics elements in the document also have titles and descriptions; in addition, the <g> (group element) wrapping the triangles also has a title. In a more complex graphic, you might have nested groups, each describing their contents, which could be explored in hierarchical detail by a screenreader user. In this case, going into this level of detail on this simple graphic is overkill; the document-level description would suffice, and the extra titles and descriptions would be more information than the average user would want to know, so I would not consider this a best practice. But it serves as an easily understood entry point.
@longdesc
@longdesc is controversial. It was deprecated in HTML5, and resurrected by accessibility advocates; many differ strongly on its value. I’m not going to opine on the attribute in general, just its applicability to SVG. I’m not sure it’s necessary to use it for SVG. On the email thread, John Foliot, accessibility advocate and outspoken champion of the @longdesc attribute, pointed me to a blog post he’d written on HTML authoring tools for @longdesc, and asked if the authoring-tool landscape for adding <title> and <desc> in SVG was on par with that.
I think it is, for the most part… with some notable exceptions.
Inkscape
Inkscape is the most popular open-source SVG authoring tool. It provides a few ways to add metadata to various parts of the document.

- Document-level title and description: this is probably the most important capability, though the least technically interesting; Inkscape gets this mostly right, though I have a suggestion for improvement. In the right-hand dialog, labeled “Document Metadataâ€Â (File → Document Metadata…), there is a space for a title (“Tilted Starsâ€), and another for the description (“Three 5-pointed stars in various colors, sizes, and positionsâ€). Unfortunately, the description field populates an RDF metadata block (thus the confusing jargon “Dublin Coreâ€, which is the name of a basic ontology around document details) rather than a <desc> element; this should actually be a simple fix for Inkscape, if we convince them that this is important… and it is important, because it will improve accessibility. (Technical note: they could kill two birds with one stone by using RDFa rather than XML-RDF; if you don’t understand what this means, that’s probably for the best.) In any case, authors are probably more likely to write a single title and description for the whole document, than for each element, and a simple overall description is more easily consumed, so the document-level metadata are important.
- Per-shape title and description: this is more technically interesting, and more interactive, but also more labor-intensive. In the top-left dialog, labeled “Object Propertiesâ€Â (select a shape, then Object → Object Properties…), there are spaces for the title (“Starâ€) and the description (“A yellow 5-pointed starâ€), which are directly inserted into the document as child <title> and <desc> elements of the shape element, meaning that they describe that specific element. Why is this interesting? Because if each shape has its own title and description, a user can explore the document with a screenreader, instead of relying on the gist provided by the author; as the document changes, with shapes added or removed, there would not need to be a detailed overall description that might go out of sync. And while no screenreader I’ve seen does this, there is the possibility for even more in-depth automatic descriptions about the relationship of different shapes; in this case, a sophisticated user agent could describe the scene like, â€There is a large yellow star at the top; below, there is a smaller blue star on the left, and a small red star on the right.†This would be tricky to do for arbitrary graphics, but for well-defined, structured graphic types, like charts and graphs, it might be pragmatically possible; I’ll touch on this later, when I talk about ARIA.
- Document tree view: the bottom-left dialog, labeled “XML Editorâ€Â (Edit → XML Editor…), shows each element in a nested tree format, including the <title> and <desc> child elements of the <path>. It’s a bit geeky, but you can use this dialog to add, remove, duplicate, or rearrange elements manually, so you could add <title> and <desc> by hand. But why would you, when there’s a dialog for that? Well, you could use it to add a document-level <desc>, or to group elements together and add a single <title> and <desc> to the group (i.e., <g> element). And it’s sometimes useful to see the structure of your document, in general.
I give Inkscape a B+ for basic accessibility metadata authoring! Fix how the document description is embedded in the file, and make the workflow a bit more intuitive, and Inkscape will get an A.
Illustrator
Adobe Illustrator is hands-down the most popular vector drawing tool for professional designers, and it exports SVG with no problem. It also allows an author to set a title and description for the whole document, though I don’t know how to do so at the level of the individual elements. If this functionality is there, it’s not immediately obvious to me; it would be easy to add, though these drawing tools are so complex already, it might get lost in the smorgasbord of features.
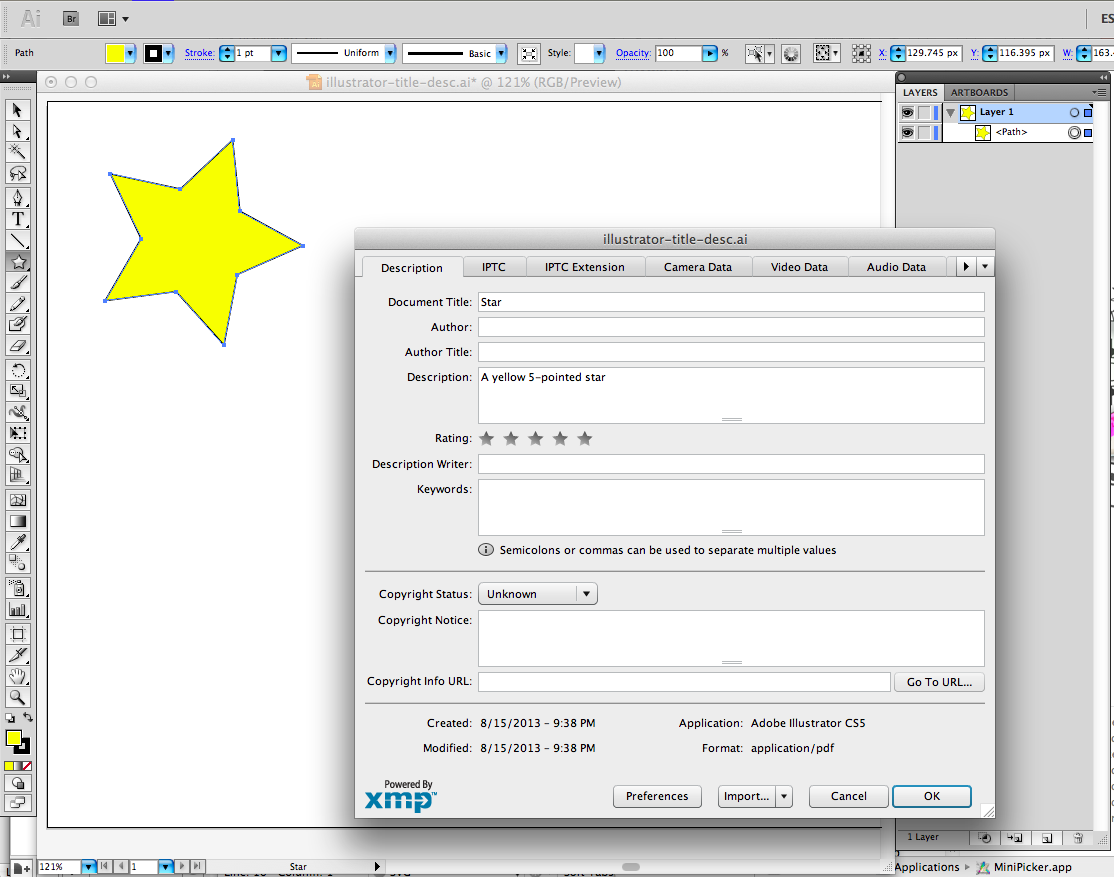
As it is, it’s not absolutely intuitive to get to this dialog, nor is it part of a typical workflow, unless the author is trying to embed license and attribution, since it’s part of the same dialog; I don’t know how common this is in practice. On the “File Info†dialog (File → File Info…), there are fields for Document Title and Description.
Unfortunately, and surprisingly, this does not save the file with an SVG <title> and <desc>, as you might expect; if you do choose the option to save the SVG file with XMP (Adobe’s Extensible Metadata Platform), it still doesn’t use the native elements, and inserts a huge block of RDF-XML markup, which seems to contain a raster (bitmap) fallback of the image, and dramatically bloats the file size!
| option | file size | size increase |
|---|---|---|
| no metadata | 715 bytes | 1x |
| simple SVG <title> and <desc> | 780 bytes | 1.09x |
| XMP, no raster fallback | 33,965 bytes | 47.5x |
| XMP, with raster fallback (default) | 47,596 bytes | 68.7x |
Adding a title and description makes the file nearly 70 times larger by default (or a mere 47 times if the raster image is manually removed), which is not Web friendly, and doesn’t help accessibility; that’s the worst of both worlds. As a exercise in absurdity, I opened a simple Illustrator SVG file in the ChromeVox screenreader, with title and description in XMP RDF markup just the way Illustrator saves it, and let it read out all the metadata; it took an astonishing 45 minutes of gibberish as the screenreader tried its best to meaningfully speak the “text†content (the embedded encoding as JPEG, and subsequent color settings) of a file that contained a simple yellow star. Obviously, this was not meant for consumption by screenreaders.
Based on this, I have to give Adobe Illustrator a D for basic accessibility metadata authoring. It doesn’t currently output accessible SVG, but it does have some of the infrastructure in place.
How could they fix it? Simple: add fields in the “SVG Options†save dialog for title and description, and save them as SVG elements. That would also solve the workflow problem of this being hard to find. Consider adding a way to add a title and description on individual shapes and groups, either in a dialog available from the Objects menu or in the Options modal dialog from the Layers sidebar (where you can currently set the id attribute from the Name field).
Hand-Authoring
I have to confess, having done SVG for 13 years or so, I am pretty comfortable with hand-authoring SVG. This is crazy, however, and I don’t recommend it. That said, it’s pretty simple even for an SVG newbie to take an SVG file you’ve drawn in an authoring tool, open in the text editor of your choice,  and manually add metadata; browser debugging tools make it even easier to find just the right elements. If you’re modifying it for even the most basic interactivity, you’re probably going to be doing this step anyway, so adding accessible metadata while you’re at it is not an onerous task.
Most people don’t create their own SVGs. They typically reuse SVG icons or images from a image-sharing service like The Noun Project, OpenClipArt, or IcoMoon, and integrate them into their site as-is, linked directly from HTML or referenced from CSS, or combine them together in a single large SVG file with multiple images that make a single scene (which is what I often do). I call this combination of SVG images the “icon collage techniqueâ€. This has been extremely effective for me, especially when I’m making slides for a presentation, though it’s not without its challenges, mostly owing to the different sources of the images; the images are often of inconsistent quality, and almost none of them include their own titles or descriptions; from a combinatorial perspective, they are also less reusable because they typically aren’t auto-scaling, and most people don’t know how to resize the SVG. These image-sharing sites should optimize for this kind of reuse, and should provide titles and simple descriptions by default, so that an SVG collage is somewhat self-describing with no extra work on the part of the author.
Scripted SVG
This is the real payoff. Most SVG files, especially graphs and charts, are neither lovingly hand-crafted nor painstakingly drawn in a drawing tool. They’re scripted, server-side with R or PHP or other server languages, or increasingly client-side with JavaScript, with Raphaël or D3.js.
One of the most popular JavaScript libraries for creating data visualizations is D3.js, which stands for “Data Driven Documents. D3.js gives the author a lot of power, because it leverages SVG’s DOM structure and extends it with syntactic sugar and helper libraries. Adding a <title> element to a bar in a bar chart, for example, is trivially easy in D3.js (and Raphaël, for that matter).
Here’s a small demo of a “tooltip†example (source code) from chapter 10 from Scott Murray’s “Interactive Data Visualization for the Webâ€, a good book on getting started with D3.js. In this example, sighted users (without mobility problems) are shown the data in 2 ways, as a rough gist from the visual representation of the bars, and as raw numbers in the tooltip on hovering (a little nice-to-have easter egg); users of a screenreader will get the raw numbers from the title. The relevant part of the code, which creates a bar chart from a simple array of numbers (represented by the object d), is here:
  .append("title")
    .text(function(d) {
      return d;
    })
Four short lines of code, saying “add a <title> element here, with the text reflecting the value of the barâ€. A meaningful description of the whole chart would be more effort, but remember that the elegance of SVG’s “discrete serial aggregate†metadata model (my fancy way of saying “building up the big picture one relevant bit at a timeâ€) doesn’t need more lengthy descriptions for structured content; comprehension is an emergent property of the graphic, just as it is for sighted users.
This is the way to go for dynamically generated content that may change day-to-day, or even be updated in real-time.
A Real Example: Data Visualization
What did I mean by all that mumbo-jumbo? And isn’t that bar chart a little abstract, with no real data? Let me show you a different approach, with real data and a real bar chart (albeit a static one).
In fact, hidden metadata is not necessarily the best way to provide a description. Visible text can be even better, as the WebAIM @longdesc article says; that way, it benefits everyone. I took the liberty of recreating their bar chart from that example, in SVG (yes, I did it by hand, because there’s something wrong with me).

It’s not a perfect duplication, but it’s good enough. I took a couple liberties (like adding the percentage symbol to the values) to make it work better. If you follow the link and view the source, you’ll see that I didn’t really use <title> or <desc> elements… but this example should render in a screenreader almost identically to WebAIM’s @longdesc text:
Percentage of Total Noninstitutionalized Population Age 16-64 Declaring One or More Disabilities
- Total declaring one or more disabilities 18.6%
- Sensory (visual and hearing) 2.3%
- Physical 6.2%
- Mental 3.8%
- Self-care 1.8%
- Difficulty going outside the home 6.4%
- Employment disability 11.9%
How? Trivial: I just made the text from the legend and the values labels of the bars the same <text> element, positioning the values above each bar with the <tspan> element. Remember, text in SVG is rendered (or read) in document order, not in positional order.
The beauty of this approach is that it degrades fairly gracefully in browsers that don’t support SVG (or even images), even for sighted users: the text content is just presented as text, so for information graphics, a simple list of the relevant data is better than missing the data completely.
And for authors, the wonderful thing about using visible text is that Inkscape, Illustrator, and I’d reckon any other vector editor already supports this splendidly, with lots of options to please designers. The days when you needed to use images for interesting-looking text are all but gone, with the rise of Web Fonts (and the WOFF specification) and the proliferation of hundreds of free and commercial fonts available for use on the Web. The only criticism I have for Inkscape and Illustrator here is that when the author chooses to convert the text to an outline rather than real text, so they can tweak the glyphs, neither authoring tool automatically provides a <title> with the replaced text for the containing group (or layer, in Illustrator parlance); this would be a simple and intuitive fix for accessibility, one that they author wouldn’t even have to know about or set explicitly. For this reason, I’m giving both Inkscape and Illustrator a B for accessible visible text authoring; each will get an A when they automatically provide the alternative text in the <title>.
Not to dismiss @longdesc, which may have value for photos and graphics that were created by someone else, but using visible text and metadata internal to the image file itself  is far more elegant. No complicated procedure to create additional content which could get out of sync, no separate location/URL for that content, no need to force someone to navigate to that content… just a pure, simple inline experience of the same content as everyone else, just in a different modality, in which the description is an inherent characteristic of the graphic, and travels with the graphic wherever it is used.
The question now is, do screenreaders support it?
Browser and Screenreader Support
If you’re using a screenreader to read this article, you may not have experienced that elegant solution that I described. Why? Because your screenreader may not yet support SVG completely, or at all. To you, I apologize, and I’m working to make it better. Henny Swan, an accessibility expert, wrote a blog post a few years ago expressing concern about support for SVG in browsers and AT, which has genuine implications for accessibility. Fortunately, I believe that support has improved since then.
I’ve done several experiments with ChromeVox, a screenreader extension for Chrome, and it’s older cousin FireVox, for Firefox. Both will treat inline SVG (that is, SVG content inside an HTML file) as â€unknown elementsâ€, and consequently will read out the text contents of elements like <title>, <desc>, <text>, <tspan>, and <textPath>, and will sometimes find links (SVG also uses the <a> element, though with slightly different attributes; this will change to match HTML5 for SVG 2). This is good. However, neither will read standalone SVG files, nor read SVG files referenced in <iframe>, <object>, <embed>, or <img> elements of an HTML page; this should be fairly simple to change, however, and I’ve started discussions with the developers about this. Since script libraries like Raphaël and D3.js produce inline SVG by default, this is not an issue for most JavaScript solutions.
On the one hand, screenreaders still present a challenge, and they are inconsistent in which elements they read out. In order to not provide too much data, they should limit what they read only to SVG elements, not any metadata (like RDF licenses or alternate encodings) that happens to be embedded in the file. In fact, the text contents of the <metadata> element should simply be skipped over completely, as should the contents of the <script> and <style> elements; none of these is meant for human consumption.
After Open Web Camp 2013 last month, where I gave my “Invisible Visualization†talk on making data visualizations accessible, I spent some time with a set of people –Glenda Sims, Estelle Weyl, Katie Haritos-Shea, and Denis Boudreau– to do some basic SVG-in-HTML testing with multiple browsers in combination with NVDA, JAWS, and VoiceOver (three common screenreaders), with generally positive results on reading SVG <title> elements. We didn’t record the results, and I didn’t examine the tests in detail,  so we clearly need more robust testing, but anecdotally,  I was pleased with the improvement  in support from just a couple years ago.
James Craig, an Apple accessibility expert, informed me that in WebKit, the SVG DOM (that is, the browser’s internal model of the document) is exposed to the accessibility APIs, so <title> and <desc> elements should be available to any DOM-based screenreader. This is also encouraging.
Identifying and activating links inside SVGÂ are still a consistency challenge for screenreaders (at least in ChromeVox); this is less important for simple images, but for anyone wanting to use an SVG as a kind of advanced image map, or who wants to add drill-down capability to their chart, this is a real problem that screenreaders need to address.
Also, currently all the text in the SVG is (at least in some screenreaders) read out as a single passage, rather than as structured, navigable items; it would be better to treat each textual element as an individual item, so a screenreader user could easily go back to repeat the last item, or the first item on the “listâ€. Treating the text content as a list (or set of nested lists) would be a good general algorithm.
To keep momentum going forward, I started a W3C Accessible SVG Community Group a few weeks ago, and it’s already got 18 participants; we’ve started planning a hackathon, maybe collocated with the SVG Working Group’s face-to-face meeting in October, to test SVG accessibility. We will publish a report, and after that, we should have a much better idea on where the current state of SVG accessibility support is, and what specifically needs to be improved.
Ugly Bits
Lest you think that browser support is the only problem here, let me disabuse you of the notion that SVG accessibility techniques are otherwise bulletproof. In the static chart example above, I told you the first thing someone using a screenreader should hear. But I didn’t tell you the last part, which the screenreader will speak after reading out the useful information:
Types of Disability
Percentage of Total U.S. Population (178,687,234)
0 2 4 6 8 10 12 14 16 18 20
These are the axes labels… mostly noise left over from the depiction of the data, an artifact of the visual aspect (well, actually, the y-axis label is useful information, but it’s presented out of context).
It’s easy enough for a screenreader user to simply skip over these… if they know that they aren’t important, and that they aren’t misplaced in the middle of important content. But how could they know that the series of numbers are just the axis tickmarks, and not a series of values? Especially people who’ve been blind from birth, and have never seen a bar chart, and don’t know what bits are core information and what bits are extraneous.
So, it’s important for an author to put the information in the right sequence, in the correct document order; necessary, but not sufficient.
An author could make judicious use of the aria-hidden attribute to hide the extraneous content from screen readers, while still rendering it on-screen. ARIA stands for “Accessible Rich Internet Applicationsâ€, and it defines a set of roles, states, and properties that help represent various widgets, such as forms or user interface controls, to a user that can’t see the visible indicators of state or intent; if you have a purely CSS checkbox or selector button, ARIA can help non-sighted users to know that it’s unchecked, or which option-state is selected.
The ARIA attribute aria-hidden=”true” is the screenreader equivalent of the CSS rule visibility: hidden;; in other words, while elements will still be rendered to the screen for sighted users, they will not be read out for non-sighted users. It‘s not necessary to use this on any graphics element, or to worry about the document order of graphics elements without titles, because they should be “invisible†to screenreaders anyway.
To emphasize that, at the risk of seeming obvious, screenreaders should not typically try to “read out†the characteristics of graphics elements directly. Perhaps there could be a special mode in which they do so, but even sighted users would have a hard time making sense of all but the most basic SVG shape descriptions; you might be able to mentally picture what this element looks like, what it’s shape is, where it’s positioned, how big it is, and what color it is:
<circle cx="85" cy="120" r="20" fill="crimson" />
But could you tell what this looks like?
<polygon points="72.75,100 100.25,100 112.75,122.75 100.25,145.5 72.75,145.5 60.25,122.75" fill="rgb(128, 0, 128)" />
It’s a simple shape, a purple hexagon; <path> elements get far more complex and impenetrable.
So, it‘s up to the author to provide text equivalents for different graphical shapes. But does it matter that on a bar chart, “Employment disability†is represented by a blue rectangle about 79 pixels high and 33 pixels wide? No. So the author has to provide an appropriate level of abstraction and meaning, as well.
In addition to not knowing what bits are important, another unfortunate aspect of simple document-order reading of text is that screenreader users can’t easily navigate around a chart, comparing the values of different bars, the way a sighted user could.
ARIA may be the answer here. As currently defined, ARIA is specifically aimed at user-interface controls, like sliders or choice menus. For the most part, GUI controls are a concrete set of well-defined and bounded conventions, each fitting a specific task, which users learn to manipulate in pre-determined ways; data visualizations represent a different set of conventions with a similar set of constraints. So, we could extend ARIA to represent the roles, states, and properties not only of GUIs, but of data visualizations, to allow visually-impaired users to explore and interact with the visualizations in much the same way as with a GUI. We could add much-need structure to these data visualizations, with new ARIA roles and states, and improve navigation options.
For example, look at a bar chart. A sighted user will scan the axes to contextualize, then compare different specific bars to one another, or look at the overall trend; a y-axis with the numbers 0–20, or an x-axis with a set of dates, is meaningful, because it sets the range of values or dates. For a screenreader user with some future ARIA markup on those axes, the endcaps of the numeric or date range could be spoken (e.g., â€0 to 20,000, in increments of 1 thousandâ€, or  “January of 2007 to December of 2011, in quartersâ€). But for now, that’s speculative.
In the meantime, don’t add titles when visible text will suffice, and don’t duplicate information in a <title> or <desc> that’s already available as text. Duplicated information is repetitive, redundant, superfluous, periphrastic, and unnecessary. It’s extra work anyway, so just don’t do it.
Why Add Metadata?
Okay, so why should you do this in the first place? Assuming common decency isn’t enough reason, and that you’re laboring under the delusion that you don’t have a visually-impaired audience (or that you won’t be part of that demographic as you get older), you should understand that providing lots of titles and descriptions helps make your content more findable; Google indexes SVG files now, and they use text content as part of their search criteria. And it also makes it better for understandability; sure, it’s easy to find an star element by looking for
  <path d="M362.85712,640.93361 239.55735,528.28863 76.862579,565.99989145.89259,413.92562
           59.751606,270.84712 225.71427,289.50503 335.17099,163.3664 368.71155,326.97188
           522.5005,392.09242 377.26704,474.54827 z"
           transform="translate(-20,-108.57143)"/>
… but if you add a <title>Star</title>, it’s even easier to find, for you and for anyone maintaining or reusing your content. And if that’s still not enough rationale, in most browsers, the <title> is revealed as a tooltip on mouseover, so in your map of your country, each state or region gets its own tooltip for free.
Author Awareness
So, I’ve talked at length about the what, how, and why of SVG accessibility, and now I want to say something about the who: you! Well, you and a bunch of other people. None of this is hard, not nearly as hard as simply making people aware of the technique and the impact it has. So, if you’re using SVG, use these techniques so others become aware of them; if you’re not using SVG, start doing so. Tell other people about how to make their graphics accessible (and tell them to use SVG). If you have a script library or application that outputs SVG, try to make the SVG accessible.
For my part, once we have things a bit better defined, I’ll be writing this up in a more comprehensive, instructional style on Web Platform Docs, so more people discover it.
And if you’re interested in helping us clarify the current state of SVG accessibility, and to plan future improvements, I encourage you to join the W3C Accessible SVG Community Group. It’s a free and open group, with smart, passionate people who are helping make the world a better place (so if you’re not smart, apathetic, or kind of a cynical, self-absorbed jerk, you don’t need to join).
Describler
In writing this blog post, I scratched my own itch and started a little prototyping project called Describler to help improve your SVG’s accessibility. It lets you upload your SVG file, and provides you a graphical tree view of your current SVG, and lets you add or change titles and descriptions.
Using the miracle of modern browser technology, it even lets you hear how your SVG should sound in a screenreader, using the experimental Web Speech APIÂ (which sadly only seems to work in Chrome, and only then after you enable its flag). I’m hoping this spec moves forward quickly, and is adopted by other browsers, because it’s super-cool.
Describler does a few more things that help accessibility and reusability as well, like making your SVG auto-scaling, so you can use it at any size, and it will grow or shrink to fit the size of the container.
I did this as my W3C Geek Week project, where we set aside our normal work to improve our skills; I really enjoyed getting to code again, and I hope to keep expanding Describler, so maybe I’ll talk more about it another day. I have a bunch of ideas for improvements, and if you have suggestions too, make a comment or pull request on my github repo. (Be kind, please… I knocked this out in just a few days, and I know the code and interface are a bit ugly still.)
Conclusion
Adding titles and descriptions is only one aspect of accessibility in SVG. Interactivity and keyboard navigation, zooming and panning, link activation, document hierarchy, color choices, animation control, and many other factors come into play for various accessibility needs. But providing non-visual representation for users with visual disabilities is the most obvious accessibility challenge for a graphics format, and it is the closest analog of the behavior of @longdesc.
Not all authoring tools have sufficient support for adding accessibility. They should add it, and we (those of us in standards, in the SVG WG, and the people using those tools) should define better how they should do it. But adding accessibility metadata features are easy, and visible text is already well-supported in authoring tools, so I’m optimistic. I hope tools like Describler will help, as well, and will fill the gap until native authoring tool support is better.
My current inclination is that more testing is needed to determine how widely SVG accessibility features are supported, and in the meantime, I don’t see harm in providing a @longdesc, unless it simply duplicates what’s already in the SVG (remember what I said about duplication). My prediction is that for script-based data visualizations, at least, there’s almost no chance that people will provide a @longdesc, and a reasonably good chance they’ll provide discrete titles; for other uses of SVG that might need a longer description, there’s still a better chance that people will provide a <desc> than a @longdesc, because even with authoring challenges, it’s easier to enhance one file than create and maintain two interlinked files. As a pragmatic matter, I think the notion of using @longdesc with SVG is largely academic, and will be of decreasing importance going forward.
I’ve read claims that @longdesc is a requirement in some organizations and countries, by law or policy; if this is the case, I believe that SVG’s native capabilities should satisfy those requirements, and policies should be revised to address that, where applicable.
The more accessible SVG content is produced, the more compelling the case for native browser and AT support, and the better the experience for people who need an alternative for graphics. So, go make some great content, please!
Terrific intro article Doug.
You mentioned using the Web Speech API. It sparked a thought – could the Web Audio API be used to supplement the accessibility of SVG charts/graphs? Changing pitch/tone to indicate peaks/troughs etc.
Thanks, Léonie!
Yes, the Web Audio API absolutely can be used for that. In fact, I made a demo for my latest talk, “Invisible Visualization†about making data visualizations accessible (so far presented at OpenVis Conf and Open Web Camp). You can try the rough prototype here, using arrow keys (up or left for panning left, down or right for panning right across the linechart):
http://schepers.cc/svg/accessibility/sonifier/Sonifier.svg
Like I said, that’s just a rough prototype, but I’ll be developing it further into an open-source script library with support from Benetech.
Update:Â I’ve just done several tests using VoiceOver, the iOS/MacOS native screenreader, and I was impressed with its treatment of SVGÂ in Safari, Chrome, and Firefox (it didn’t work that well even in HTML in Opera, so I’m setting that aside for now):
These results will help us define and refine how a screenreader should behave, but can also serve as an exemplar, raising the bar.
A quick and dirty check using your bar chart example…
Jaws 14, Jaws 15 and NVDA 2013.2 all read the contents of the text elements in Firefox 25.
In Internet Explorer 10, Jaws 14 and Jaws 15 behave as though the page were empty. NVDA 2013.2 reports “Bar chart graphic”, but does not read any of the text content.