SVG paths have a pretty good set of shape commands, enough to let you draw any 2D shape you might want in an authoring tool: horizontal, vertical, and diagonal straight lines, elliptical arc segments, and cubic and quadratic Bézier curves. Béziers are great, giving you precise control over the position and curve interpolation of each point in a concise format, using control points (“handles”), and are easily chained together to create complex shapes.
But let’s say you have a series of points, and you want to draw a smooth line between them, e.g. for stock data, an audio wave, or a mathematical graphing equation. Béziers are not as handy there, because not all the points needed to define a Bézier spline are on the curve itself. Obviously, you can decompose any set of points into a set of Béziers, but that takes math, and who wants to do that? (Put your hand down, nerd. I’m talking to the normals.)
Sometimes, you just want to lay down a set of points, and let the browser draw a smooth curve (unlike polylines, where each segment is just a straight line between the points). Like this:
Mouse over the line above to see the equivalent cubic Bézier points. They are off the line. Off the line! Oh, Math, why do you do this to me?
One thing that’s always bothered me about SVG… there should be more simple ways of doing things, and this is one of things. Over the years, I’ve idly asked math-minded folks about how to achieve this, and the answers always soared right over my pointy little head. I probably didn’t ask the question the right way.
But a few months ago, I was chatting with Ben Fry, one of the creators of Processing (the graphics programming language), and he mentioned Catmull-Rom curves as a possible solution. I took note of that, and later read up on them; they seemed a pretty good fit for my use case. In my spare time I looked for any libraries out there to convert Catmull-Rom curves to Bézier splines; I found references that talked about the the conversion using inverted matrixes, but no simple code to be had. I’m lazy, and busy, and the problem wasn’t urgent, so I kept putting it off.
But in talking to folks about SVG throughout the UK, including designers, the thought kept running through my mind that SVG really does need a better authoring experience (and I don’t just mean authoring tools, though some nice animation tools would help). So, when I got back home from vacation, before I really got back into the thick of the dozen other things I should be doing, I put on some music and spent a few hours after work scouring the intartubes for some suitable code. And as luck would have it, Maxim Shemanarev’s Anti-Grain Geometry library contained a single simplified conversion matrix and a line of code that did the grunt work in C++, easily ported to Javascript; whip up a custom parser for the <path> syntax, feed it into the convertor function, and you’ve got yourself a working proof-of-concept.
Here is a scientific chart showing how awesome the SVG <path> element is, with values derived from the overall awesomeness by different path commands, rendered using an experimental Catmull-Rom path command:
As you can see, adding Catmull-Rom curves would increase the awesomeness of SVG paths by almost 50%. That is a lot more awesome!
The syntax is pretty intuitive… it’s just the command ‘R’ followed by a set of coordinate points:
  <path stroke="#BADA55"
        stroke-width="2"
        fill="none"
        d="M20,380
           R58,342
           100,342
           100,300
           140,250
           190,210
           220,197
           250,184
           280,155
           310,260
           404,20"/>
And the path syntax isn’t just used for the ‘d’ attribute of <path> elements. It’s also used for laying out text-paths, and the shapes of SVG Font glyphs. And it’s used in animation, both for motion paths and (in the case of Béziers) for timing functions in the ‘keysplines’ easing attribute that controls the rate of animation. So, making it easier to hit specific points for paths could have side benefits for all those uses as well.
I’m really interested in feedback from others on the usefulness of this idea. I’m not married to the idea of Catmull-Rom curves specifically (Fun fact: Ed Catmull is now the president of the Walt Disney and Pixar animation studios; I believe Rom became an astronaut, was captured by aliens and turned into a cyborg, and is now a Spaceknight), just in the idea of adding this type of point-on-the-path command. So, if you support the notion of adding this in SVG 2, or have a better idea along the same lines, send an email to the SVG Working Group’s public list, www-svg@w3.org, to let us know.
The javascript library I wrote to demonstrate this is, of course, open source, available under the MIT or GPL licenses. Feel free to play around with it, and improve it to make a better proposal. You’re welcome to use it for other purposes, but I intended it just as a quick-and-dirty prototype to solicit feedback about extending SVG, so the code isn’t that great.
Update 1:
Erik Dahlström, Chief Vectorizer at Opera and chair of the SVG WG, posted a visual reply, which WordPress filtered, but I’ve now restored this inline. Nothing to see here, move along.
Update 2:
Here is my Catmull-Rom code trying to achieve the nice curves of Spiro, as suggested by Dave Crossland in his comment:
Update 3:
Looking at Spiro curves a bit closer (just the image, not the code), it seems that there are actually different node types illustrated, not simply an undifferentiated set of coordinate points as in my interpretation of the Catmull-Rom algorithm. This means that, from an syntax standpoint, those segments would need additional parameters in addition to the coordinate points on the curve, which somewhat undercuts the simplicity.
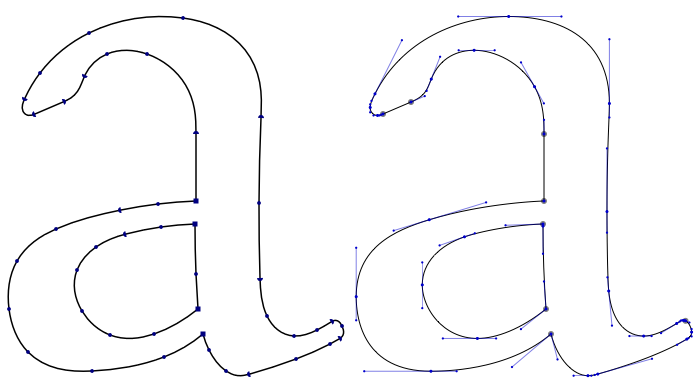
Given that SVG already has a ‘Lineto’ command, I set out to see how closely I could match the letter “a” in Raph Levien’s example, using just my Catmull-Rom and Lineto segments, and with minimal effort:
Mouse over the raster image to hide the SVG path. There are definite artifacts, and I am running into some known limitations of my script implementation in how it interpolates the last coordinate segment, but with not much effort, I was able to get pretty close.
This is not to belittle Spiro at all… Spiro generates painfully elegant curves. It’s just to compare apples to apples.
*VERY* cool!
I see two problems when looking carefully at http://schepers.cc/svg/path/path-awesomeness.svg
Â
#1) The transition from “Horizontal” to “Vertical” has a curve that bends left, then right, meaning that for some values on the x-axis the curve can take on two different values on the y-axis. Â Can perfectly vertical line segments be achieved?
Â
#2) The Catmull-Rom curves don’t seem to hit the maxima/minima properly (at “closepath” and “Arc”).
Â
is it ok to squint at these and say they’re good enough?
Â
Hi, Jeff-
Yeah, I noticed those, too. First off, I’m actually taking a shortcut with Catmull-Roms, because I presuppose a specific “tension” parameter, which would let the author tweak the tightness of the path interpolation. This make the syntax a tad more intuitive, but suffers from the problem you noticed. I could go either way… tension would just be one more number, before or after the series of points.
For your first point, authors would also have the option of breaking it into 2 Catmull-Roms and a lineto or vertical/horizontal path segments. But again, that breaks the simplicity.
Maybe we can tweak the preset tension to find one optimized for the common use case, like line charts, or something?
<img src=”xn--dahlstrm-t4a.net/tmp/talkingtonormals.png” />
What about http://www.levien.com/spiro/ ?
Dave, why use Spiro when my code produces such a lovely alternative?
http://schepers.cc/?p=243#spiro
Thank you for proving my point.
How can you foist such inferior technology on the world, you scoundrel?
🙂
Dave, I thought a bit more about the problem, and with a few tweaks, adding 5 coordinate points and converting 2 segments to Linetos, I was able to get rather closer to the Spiro example, as you can see above in Update 3. This is not to say we won’t consider Spiro curves, especially since Inkscape supports them already, it’s just food for thought.
Wow man! Very impressive 🙂 Point disproved, since with a couple more points I expect it would match almost exactly ;p
If you want to play around with making some of these Catmull-Rom curves in real-time, go for it:
http://schepers.cc/svg/path/dotty.svg
 Just click to set coordinate points. The path will render after 3 or more dots.
Love it! These curves look like a great candidate for extending SVG path syntax. Could we get some implementor to build it natively so others could experiment with it do you think?
Alex, I’d love that… you think Abbra could implement it experimentally? Maybe we could try to get it in one of the open-source browser branches? It’s similar to some stuff in Inkscape, so that could be a good toolchain test.
Transformation matrices:
cubic Bézier:
cb = [-1 3 -3 1; 3 -6 3 0; -3 3 0 0; 1 0 0 0]
cardinal spline:
s = (1-tension)/2
cs = [-s 2-s s-2 s; 2*s s-3 3-2*s -s; -s 0 s 0; 0 1 0 0]
Catmull-Rom spline: same as cardinal spline with:
s = 1/2Â <=>Â tension = 0
cardinal spline to cubic Bézier:
cs2cb = inv(cb)*cs = [0 1 0 0; -s/3 1 s/3 0; 0 s/3 1 -s/3; 0 0 1 0]
Catmull-Rom spline to cubic Bézier (substitute s = 1/2 above):
cr2cb = [0 1 0 0; -1/6 1 1/6 0; 0 1/6 1 -1/6; 0 0 1 0]
(same as in the JS code)
MS Windows GDI+ uses above s instead of tension as parameter for GraphicsPath::AddCurve() with a default value of s = 0.5.
It looks like an optional last tension parameter for an R (or perhaps K) path data command (odd number of parameters) with a default value of 0 could work.
GDI+ Cardinal Splines
GDI+ GraphicsPath::AddCurve
Wikipedia Cardinal spline
Wikipedia Kochanek-Bartels spline
This is great stuff, Public Domain, thanks much! (Who was that masked man?)
Found some more about the tension parameter.
Inkscape’s auto-smooth constraints method: Node::_updateAutoHandles()
Doug,
ÂÂ
this is fantastic, but am I missing the obvious?
ie adding end-points.
the letter a is constructed with two strokes, the pen is lifted between them.
to reconstruct this as per your example is perhaps a matrix addition?
the only 4 points effected are the 2 between and 2 below the green line-to markers.
by which I mean, please separate this issue, as it is central and natural.
Excellent to meet you at last!
Marek’s holiday SVG extravaganza:
http://svg.kvalitne.cz/ireland/irelandvacation.svg
ÂÂ
Jonathan, if you want to add disjointed segments (or strokes), like the stems and crossbar of a capital letter “A”, then a mere list of points interpreted as a Catmull-Rom would not be enough… you would have to insert a moveto (‘M’) path command before the points that establish the new stroke (for “A”, three strokes). There are algorithms that would help you do this, but essentially it comes down to the same process as when you are writing with a pencil… you lift your pencil off the paper, and set it down at the new starting point, as you say.
Fortunately, the particular way I’ve interpreted the Catmull-Rom curve allows you to duplicate start and end points without affecting how the curve is drawn, so once you detect that a moveto operation has occurred, you can simply duplicate the first coordinate pair of the new stroke to start it off.
In terms of those algorithms, there could be a new moveto triggered by distance or angle between points, for example, if you are constructing a shape only from a set of points, but ideally you’d have recorded the notation about the lifting of the pen (or mouse button), the timing involved in each interval between points, or the angle of the pen, not just to get separate strokes, but also to determine when to insert a sharp angle rather than an interpolated curve, such as with the small letter “h”, at the base of the stem going into the curve of the hoop.
(It was great to meet you at last, too; Megan and I both enjoyed your walking tour of London.)